
Drawing
draw lists shapes in a box of size, with coordinates from its top left corner, y down. Use it for what layout cannot express: dials, charts, marks. For symbols, use an icon first.
{
  "name": "Gauge",
  "size": [200, 170],
  "draw": [
    {
      "arc": [100, 100, 80, 225, 495],
      "stroke": "#ECE6DD",
      "weight": 14
    },
    {
      "arc": [100, 100, 80, 225, 405],
      "stroke": {
        "linear": ["#F29F05", "#D9485F"],
        "angle": 0
      },
      "weight": 14
    },
    {
      "line": [100, 100, 100, 40],
      "stroke": "#1A1423",
      "weight": 3
    },
    {
      "circle": [100, 100, 6],
      "fill": "#1A1423"
    }
  ]
}
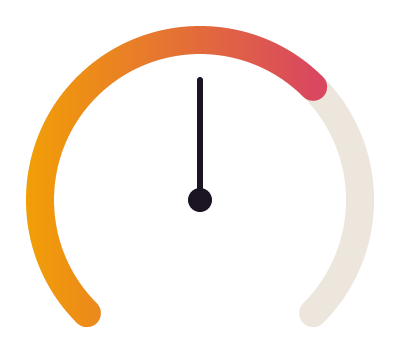
A gauge: a track arc, a value arc with a gradient stroke, a needle and its hub. Arcs run clockwise from the top, as on a clock face.
Shapes
| Shape | Numbers |
|---|---|
circle | [cx, cy, r] |
ellipse | [cx, cy, rx, ry] |
rect | [x, y, width, height], with radius (a number, or [top left, top right, bottom right, bottom left]) and smoothing (0 to 1: corners that ease into their sides, a squircle; 0.6 is the shape app icons are cut to) |
line | [x1, y1, x2, y2] |
poly | [x1, y1, x2, y2, ...], with "closed": true for a polygon |
arc | [cx, cy, r, from, to] in degrees clockwise from the top: 0 is 12 o'clock, 90 is 3 o'clock, and [cx, cy, r, 0, 360 * share] is a progress ring from the top |
path | SVG path data; several subpaths make one shape, and one wound the other way is a hole (fill-rule even-odd from SVG is kept) |
Shapes from data: plot and bars
Two shapes are written as values, not coordinates, and are scaled into the drawing's size, up the page:
| Shape | Takes | Draws |
|---|---|---|
plot | [3, 5, 4, 8], or [[x, y], ...] pairs | a line through the values, evenly spaced (or at their x) |
bars | [3, 5, 4, 8] | a bar for each value, standing on 0; "gap": 0.25 is the share of each slot left free |
{
  "draw": [
    {"bars": [4, 7, 5, 9], "fill": "@line", "radius": 2},
    {"plot": [3, 6, 6, 8], "stroke": "@accent", "weight": 2}
  ],
  "size": [280, 60]
}
The lowest and highest value of every such shape in the drawing (and 0, for bars) fill its height, so two series share one scale and nothing is divided by a maximum by hand. "domain": [0, 100] on the drawing sets the range. Beside bars, a line's points sit over the middles of the bars. They become an ordinary poly and rects with the keys written beside them (stroke, fill, radius, dash), so they can be restyled like any shape; other shapes in the same drawing stay in its own units.
Under a line, "area": "@accent/12%" beside plot fills down to the drawing's bottom, and "dots": 3 puts a dot of that radius on each point (true sizes them from the line). A level across the chart is a second plot of two points on the same scale: {"plot": [[0, 30], [11, 30]], "stroke": "@mute", "dash": [6, 4]}. Written as a chart, {"chart": "line", "data": [12, 18, 15, 22], "area": {"fill": "#2563EB", "opacity": 0.12}, "points": true, "target": {"value": 20}, "width": 480, "height": 240} is read as that drawing.
One bar in another colour: "highlight": "@accent" beside bars paints the tallest bar, and "fills": [null, null, "@accent"] gives a bar its own (a null keeps the shape's fill).
A ring by its shares is written as a chart and read as a drawing of arcs: {"chart": "donut", "segments": [{"value": 50, "fill": "@accent"}, {"value": 30, "fill": "@good"}, {"value": 20, "fill": "@line"}], "size": 160, "thickness": 20, "center": {"text": "$48.2k"}}. thickness is the ring's width (innerRadius gives the hole instead: a share of the radius up to 1); center is a text over the middle, bold and sized to the ring unless it gives its own font or style. The note in the reply shows the stack of draw arcs it became, which is what source prints and what you restyle.
For the common charts, the kit that ships has parts over these: {"spark": {"values": [...]}}, {"bars": {"values": [...]}}, {"stack-bar": {"items": [{"value": 62, "tone": "@good"}, ...]}} (shares by grow weights), {"meter": {"percent": 62}} and legend. See the kit.
Paint
A frame's own stroke has no caps. For a dotted or perforated border, draw the outline over the frame in a stack: {"stack": [card, {"draw": [{"rect": [1, 1, 218, 88], "radius": 10, "stroke": "@line", "weight": 2, "dash": [0, 6]}], "size": [220, 90], "inset": 0}]}; the rectangle sits half a weight inside the drawing so its dots are whole.
A drawing with "width": "fill" (or "height": "fill") in a row or column takes the room it leaves, and its shapes stretch with it from their size: a rule drawn 100 wide spans the column. The drawing's own fill (and cornerRadius) paints its box under the shapes. Each shape takes fill (none by default) and stroke (the node's color by default when there is no fill), with weight (1.5), dash ([dash, gap]; a dash of 0 with round caps is a dotted line: "dash": [0, 6]), cap (round by default; none, square), join and opacity (0 to 1, multiplying its fill and stroke). Colors and gradients read as anywhere else. A shape whose fill or stroke is a kit color alone ("@rose", "@rose/40%") stays bound to it: change the color in the kit, or show the drawing in another mode ("mode": "Dark"), and the shape follows. A kit color inside a gradient is written as its value.
Icons
{"icon": "lucide:clock", "size": 16, "color": "@mute"} draws an icon from the Iconify collections (lucide, mdi, tabler, ph and the rest), fetched once and cached. The first use of a name makes a component Icons/lucide:clock in a frame named Icons beside your work, and the build notes it; every use is an instance of it, so color and size are per use and one edit to the component changes them all. An icon at another size scales as a whole, its strokes with it, as the icon set draws it at that size. Swap an icon with modify Icon '{"icon": "lucide:moon"}', or from an instance with {"Icon": "lucide:moon"}. color paints the shapes the icon draws in currentColor; an icon drawn in one colour of its own (one read from a page whose stylesheet set its stroke) is recoloured whole. A token stays bound either way, so the icon follows a mode, swapped or not. A nested instance swapped to another variant keeps an icon its component swapped inside it.
A smooth-cornered shape that clips what is inside it is a mask: put the drawing first in a stack with "mask": true, and the layers after it show only inside its outline.
{
  "stack": [
    {
      "size": [824, 824],
      "mask": true,
      "maskType": "vector",
      "draw": [
        {
          "rect": [0, 0, 824, 824],
          "radius": 185,
          "smoothing": 0.6,
          "fill": "#000000"
        }
      ]
    },
    {
      "name": "Art",
      "width": 824,
      "height": 824,
      "fill": {"linear": ["#3A2418", "#120A07"], "angle": 60}
    }
  ]
}